
Introduction
Motivation
Istio 운영 시 troubleshooting까지 하려면 최소한 traffic 종류 별로 Istio 및 관련 시스템과의 연결 구조는 알아야 하겠다.
Internal Architecture by Port
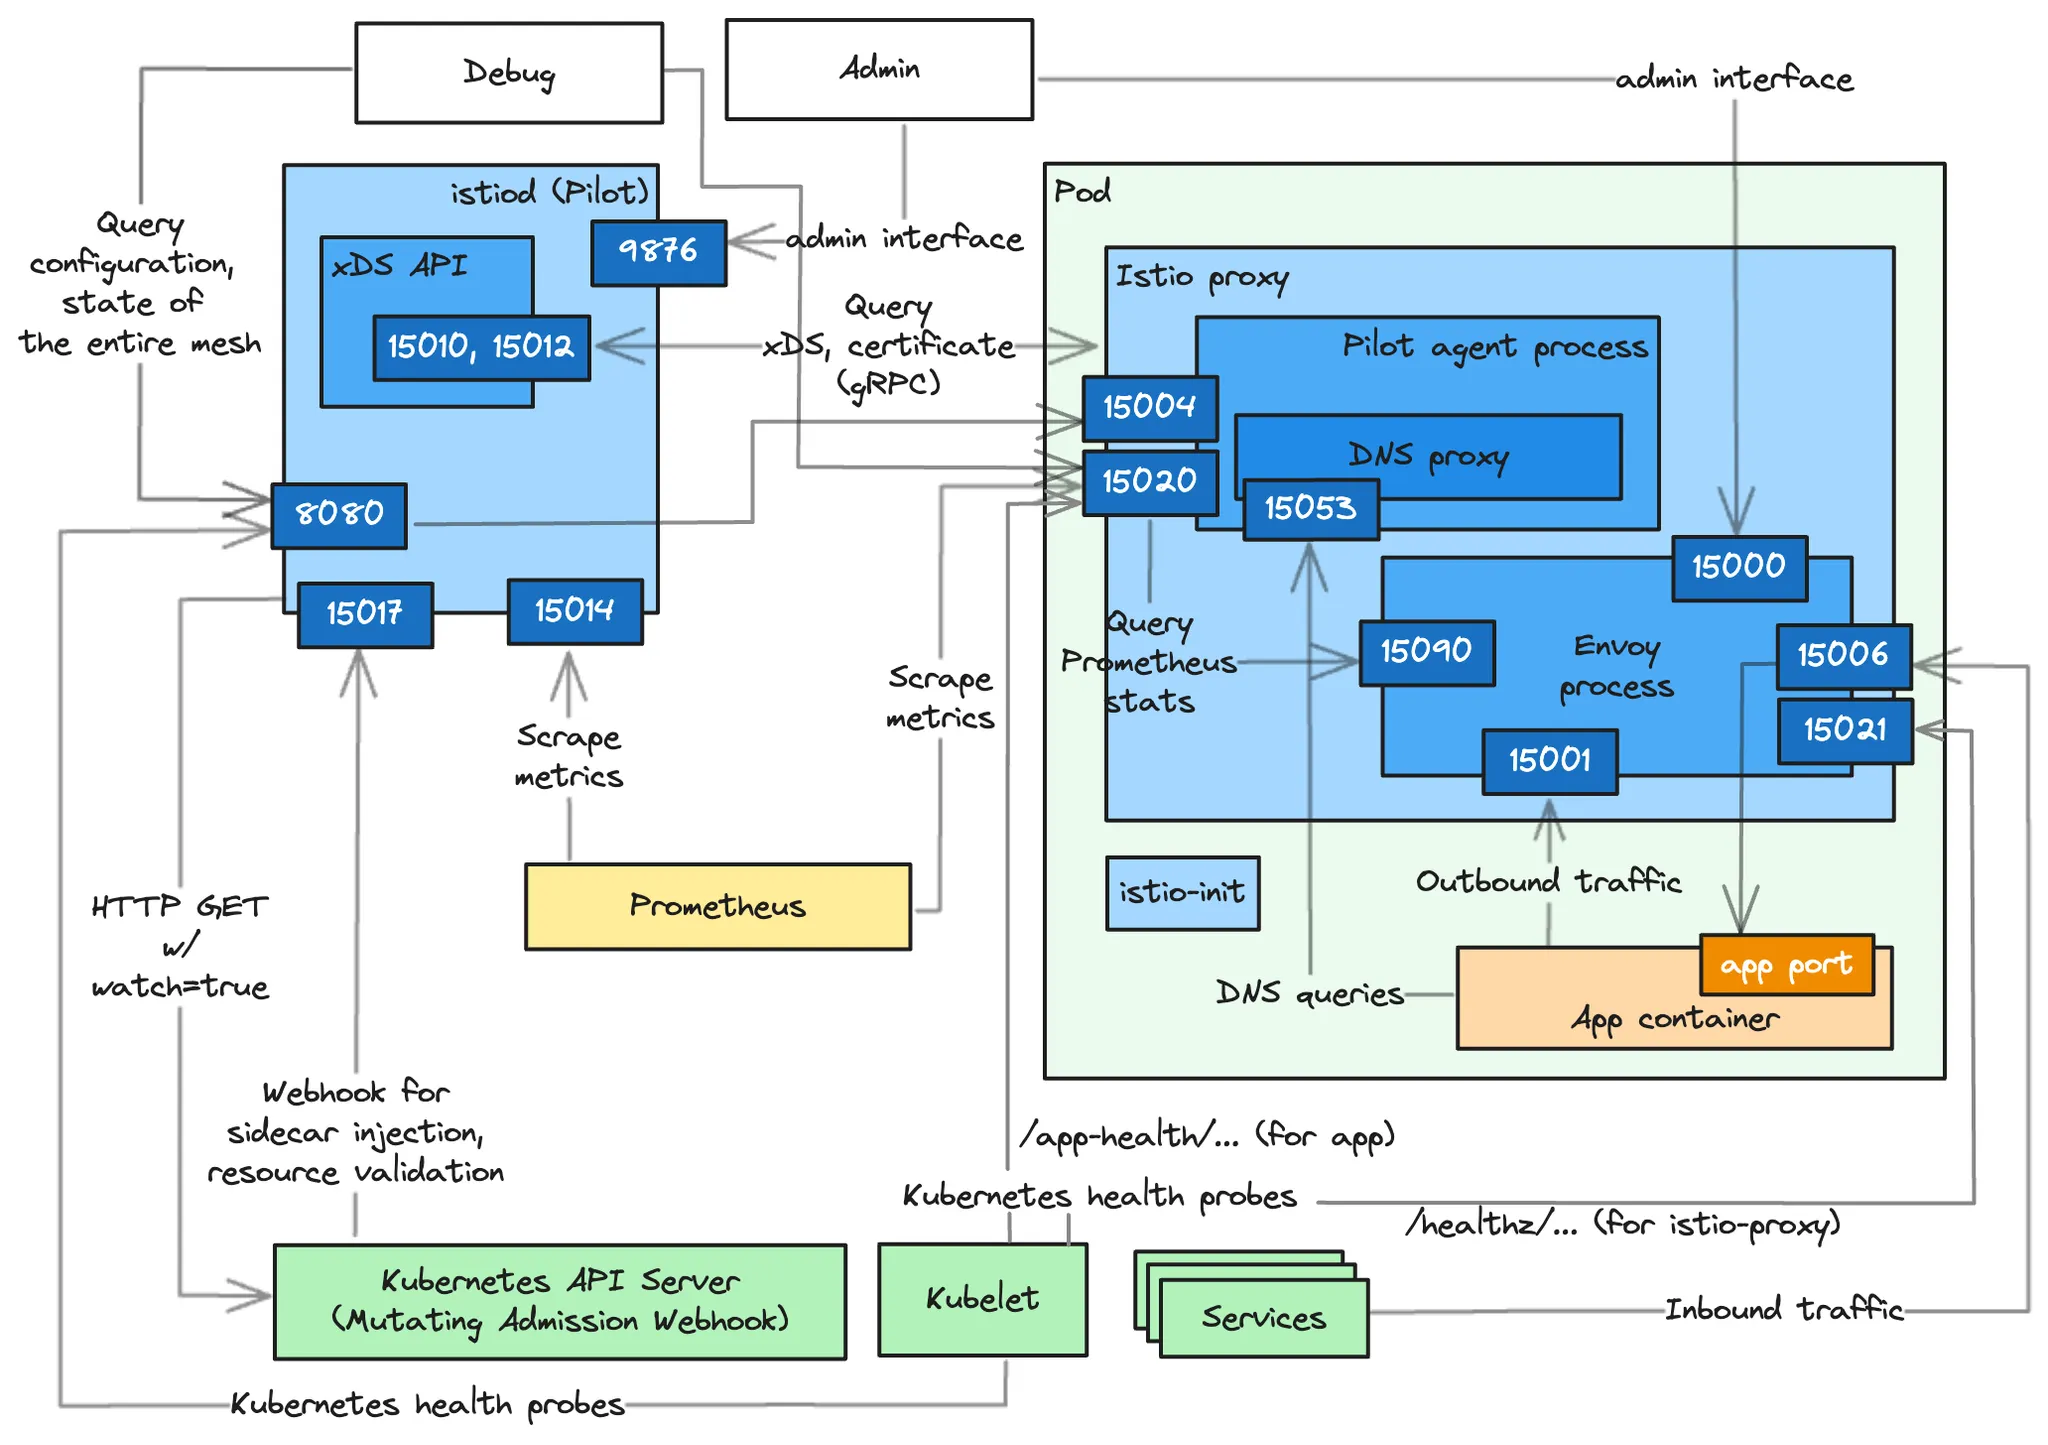
초록색은 Kubernetes를, 푸른색은 Istio를, 노란색은 Prometheus를, 주황색은 app을 의미한다.
위 diagram에 대한 상세 내용은 아래에 이어진다. Istio component를 중심으로 설명한다.
istiod
Istio의 control plane으로 Pilot은 이에 대한 옛 이름이다(원래 용도에 따라 control plane은 pilot , citadel, galley 등으로 나뉘었는데 istiod 로 합쳐졌다고). kubectl -n istio-system exec -it deploy/istiod -- netstat -tnl 명령으로 아래와 같은 port 확인이 가능하다.
Active Internet connections (only servers)
Proto Recv-Q Send-Q Local Address Foreign Address State
tcp 0 0 127.0.0.1:9876 0.0.0.0:* LISTEN
tcp6 0 0 :::15017 :::* LISTEN
tcp6 0 0 :::15010 :::* LISTEN
tcp6 0 0 :::15014 :::* LISTEN
tcp6 0 0 :::15012 :::* LISTEN
tcp6 0 0 :::8080 :::* LISTEN
Bash
복사
아래 이어지는 port 별 설명 중 각 항목 제목은 포트와 해당 port를 사용하는 client를 나타낸다.
8080: Kubelet, Debug
•
Kubelet은 /ready path로 istiod 의 readiness probing을 이룬다.
•
debug용 endpoint로 Kiali나 istioctl 가 사실 상 이 endpoint를 사용하는 듯. istioctl proxy-status 는 ~:8080/debug/syncz 을 사용하여 지정한 proxy가 sync 중인지를 확인한다고. 일부는 Istio proxy의 15004 debug port로 redirect하여 Istio proxy에 대한 조회용으로 쓰이기도.
•
매우 다양한 API를 노출하는데 여기에서 다 논하기는 어렵다. kubectl exec -it -n {istiod namespace} {istiod podname} -- curl -i localhost:8080/debug 을 호출하면 HTML이 나오는데, 여기에 전체 목록이 있다.
9876: Admin
•
istiod process의 instrospection를 노출. istioctl dashboard controlz deployment/istiod.istio-system 에 사용된다고. Istio Introspection에 대해서는 다음 참고.


15010: Istio proxy (plain text)
•
gRPC 기반으로 Istio proxy와 각종 xDS configuration을 동기화한다(SDS의 certificate 포함. xDS는 Istiod 가 open하는 API로, Istio proxy가 이들 API를 사용하여 자신의 configuration을 동적으로 수정한다. xDS에 대해서는 별도의 글로 다룬다.
•
plain text 기반이므로 보안에 취약하다.
15012: Istio proxy (TLS, mTLS)
•
15010 과 동일 용도이나 TLS, mTLS 를 사용한다. 15010 을 대신하여 default로 사용된다.
15014: Prometheus
•
Prometheus의 scraping API를 노출하여 control plane의 metrics를 전한다.
다음은 metric 예로 kubectl exec -it -n istio-system deploy/istiod -- curl localhost:15014/metrics 의 호출 결과다(펼쳐야 보인다).
15017: Kubernetes API Server
•
Kubernetes API의 Mutating Admission Webhook을 통해 k8s API Server로부터 sidecar injection을 위한 pod creation event 및 Istio resource(e.g. Gateway, VirtualService) validation을 위한 event를 수신한다.
•
참고로, istiod는 이 webhook과 Kubernetes WATCH API의 watch=true parameter 설정을 통해 상시 Kubernetes와 state를 동기화할 것으로 추정된다. watch=true 는 kubectl get pod -w 의 -w 에 해당한다. 내부 구현은 아래 링크의 첫번째에서는 Chunked Transfer Encoding 또는 Websocket을 논하며, 두번째의 공식 문서에서는 Chunked Transfer Encoding만 논한다. Persistent connection 기반이므로 push 방식으로 event를 수신할 것이다.


Chunked Transfer Encoding은 server push를 위한 HTTP persistent connection 기법 중 하나이다.

Istio-init
Istio proxy가 생성되기 전에 실행되는 Istio-init은 Istio proxy가 위치할 pod의 Iptable rule을 설정한다. 이 rule을 따르는 path는 DNS query(from app to DNS proxy)를 포함한 app과 Envoy 간 in/outbound traffic이다.
Istio proxy
Istio proxy는 내부적으로 Pilot agent, Envoy 두 개의 process로, DNS proxy는 Pilot agent의 일부로 동작한다. kubectl -n {namespace} exec -it {podname} -c istio-proxy -- netstat -tnl 명령으로 아래와 같이 Istio proxy가 노출한 port 확인이 가능하다.
Active Internet connections (only servers)
Proto Recv-Q Send-Q Local Address Foreign Address State
tcp 0 0 0.0.0.0:80 0.0.0.0:* LISTEN
tcp 0 0 127.0.0.1:15053 0.0.0.0:* LISTEN
tcp 0 0 127.0.0.1:15004 0.0.0.0:* LISTEN
tcp 0 0 127.0.0.1:15000 0.0.0.0:* LISTEN
tcp 0 0 0.0.0.0:15021 0.0.0.0:* LISTEN
tcp 0 0 0.0.0.0:15006 0.0.0.0:* LISTEN
tcp 0 0 0.0.0.0:15001 0.0.0.0:* LISTEN
tcp 0 0 0.0.0.0:15090 0.0.0.0:* LISTEN
tcp6 0 0 :::80 :::* LISTEN
tcp6 0 0 :::15020 :::* LISTEN
Bash
복사
아래 이어지는 port 별 설명 중 각 항목 제목은 포트와 해당 port를 사용하는 client를 나타낸다. 괄호 안은 해당 port를 노출하는 component 이다.
15000 (Envoy): Admin
•
Envoy의 administration interface port이다.
•
kubectl exec -n {namespace} {podname} -c istio-proxy -- curl http://localhost:15000/clusters?format=json 와 같은 방식로 호출 가능하다.
15001 (Envoy): App container
•
Iptable rule에 의해 app의 outbound traffic이 이 port로 들어온다. 이후 해당 traffic을 destination service로 routing한다.
15004 (Envoy): Debug
•
debugging용으로 istiod 의 8080 과 동일 역할이다.
15006 (Envoy): external services
•
Iptable rule에 의해 app으로의 inbound traffic이 redirect되고, 이후 이 traffic은 app의 해당 traffic port로 전달된다.
15020 (Pilot agent)
다수의 client가 각기 다른 목적으로 사용한다.
•
Health checking
◦
/healthz/ready: Envoy와 DNS proxy에 대한 health checking path. 15021 port로부터의 해당 요청을 받기도 한다. 15021 port 설명 참조.
◦
/app-health/: app의 readiness, liveness probing을 대신하는 path. Istio는 app probing path를 본 path로 변경하여 probing을 대신하며, ISTIO_KUBE_APP_PROBERS 환경 변수에 설정된 원래의 probing path로 probing request를 redirect 한다.
이에 따라 Istio injection이 완료된 pod의 readiness, liveness path는 각각 /app-health/{app container name}/readyz, /app-health/{app container name}/livez으로 바뀐다.
아래는 ISTIO_KUBE_APP_PROBERS 환경 변수 예제(app명은 dockebi)로, 원본과 실제 간 probing path mapping 현황을 보여준다.
- name: ISTIO_KUBE_APP_PROBERS
value: >-
{"/app-health/dockebi/livez":{"httpGet":{"path":"/v1/health","port":8080,"scheme":"HTTP"},"timeoutSeconds":1},"/app-health/dockebi/readyz":{"httpGet":{"path":"/v1/health","port":8080,"scheme":"HTTP"},"timeoutSeconds":1}}
YAML
복사
아래는 관련 Istio 공식 문서이다.


•
Prometheus: /stat/prometheus path로 scraping API를 노출하여 해당 sidecar 및 app의 metrics를 전한다. 이 request는 Envoy의 15090 port로도 전달되어, 최종적으로 Envoy의 metrics도 포함한 response를 전한다.
다음은 metrics 예로 kubectl -n cluster exec -it docserver-59f78d66f6-ldg79 -- curl localhost:15020/stats/prometheus 의 호출 결과로 Envoy의 항목은 제외한 결과다(펼쳐야 보인다).
•
Non-Kubernetes worloads(e.g. VM): Envoy와 DNS proxy 및 (설정할 경우) app에 대한 health checking 용도로, Kubernetes 이외의 workload에서 사용된다.
•
Debug: debugging용으로 istiod 의 8080 과 동일 역할이다.
◦
/quitquitquit: Pilot agent 프로세스 삭제
◦
/debug/ndsz: DNS proxy가 보유한 hostname 목록. istiod 의 NDS(Name Discovery Service) API를 통해 설정된 결과
◦
/debug/pprof: Golang의 profiling endpoint. 하위 path로 다양한 항목을 조회 가능하며, 전체 목록은 root 호출을 통한 결과(HTML)을 통해 확인 가능. 상세 내용은 다음 참조.


15021 (Envoy): Kubelet
•
Istio proxy(Envoy 및 Pilot agent)에 대한 readiness / startup probing(liveness는 istio가 관여하지 않음) 용도로서, Envoy는 probing traffic를 15020 port의 Pilot agent로 route하여 실제는 15020 에서의 health checking의 결과가 반환된다. 상세 내용은 15020 port의 health checking 설명을 참조.
•
Readiness / Startup probing path: /heathz/ready
15053 (DNS proxy): App container
•
Istio-init이 설정한 Iptable rule에 의해 App의 DNS lookup은 15053 port로 redirect되어 DNS proxy가 DNS lookup request를 처리한다.
15090 (DNS proxy): App container
•
Envoy의 Prometheus metrics를 노출한다. 여기에는 XDS, connection, HTTP, outlier, health check, circuit-breaker stats 등이 포함된다.
아래는 kubectl -n cluster exec -it docserver-59f78d66f6-ldg79 -- curl localhost:15090/stats/prometheus 호출 결과다(펼쳐야 보인다).